
by Perma Technologies | May 22, 2026 | Data Insights, Data Visualization
In the rapidly evolving digital world, providing a seamless and engaging user experience (UX) has become a critical aspect of any web or mobile application. One of the most effective ways to elevate UX is by integrating dynamic and responsive data visualizations into...

by Perma Technologies | Mar 20, 2026 | Data Insights, Data Visualization, Uncategorized
Turning Complex Data into Business Intelligence In today’s digital economy, data is no longer scarce,clarity is. Organizations generate massive volumes of structured and unstructured data every day, yet many struggle to translate it into actionable insights. This is...
by Perma Technologies | Feb 6, 2026 | Data Visualization, Uncategorized
In 2026, data is no longer just a competitive advantage,it’s a survival requirement. Organizations across industries are generating massive volumes of structured and unstructured data, but raw data alone has little value unless it can be understood, trusted, and acted...
by Perma Technologies | Jan 2, 2026 | Data Insights, Data Visualization
In today’s rapidly evolving digital ecosystem, data is no longer something organizations simply collect , it’s something they must interpret, communicate, and act upon quickly. With businesses producing over 328.77 million terabytes of data per day (IDC, 2024), the...

by Perma Technologies | Dec 24, 2025 | Data Insights, Data Visualization
In today’s hyper-connected world, data is produced at a scale that would have been unimaginable a decade ago. Every click, customer interaction, sensor reading, supply-chain event, cloud-based workflow, and marketing campaign contributes to the vast ocean of...
by Perma Technologies | Nov 14, 2025 | Data Insights, Data Visualization
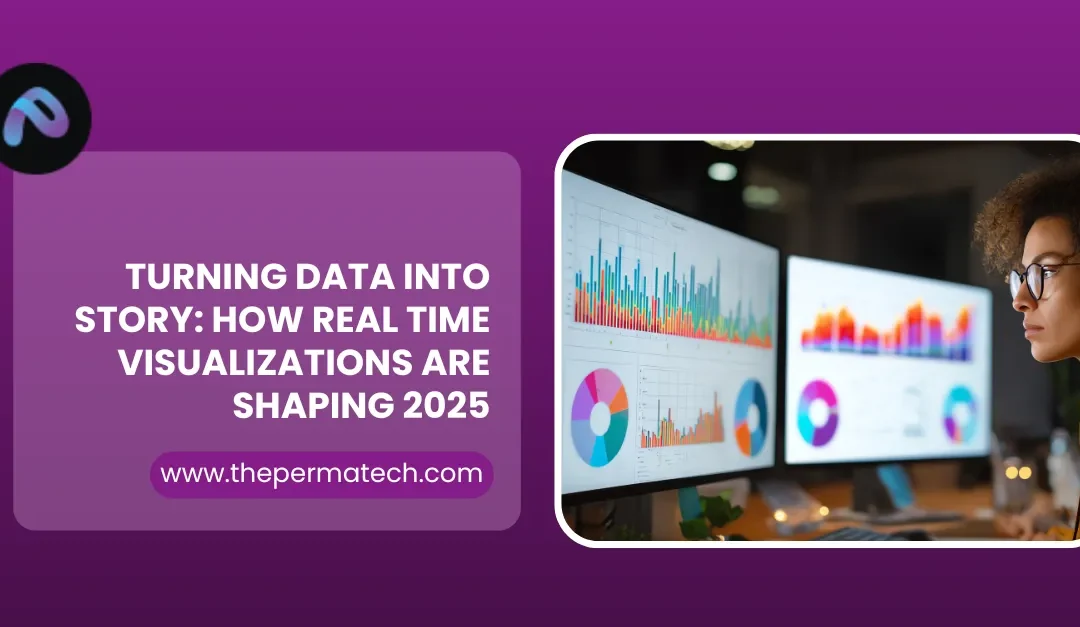
Five years ago, data dashboards were static summaries refreshed daily or weekly. Today, real time systems (powered by tools like Power BI Streaming, Tableau Pulse, and Google Looker Studio Live) ingest millions of events per second. According to IDC 2025, enterprises...